0x00 Preface
---
This article documents the details of building a vRealize Operations Manager vulnerability debugging environment from scratch.
0x01 Introduction
---
This article will cover the following:
- vRealize Operations Manager Installation
- vRealize Operations Manager Vulnerability Debugging Environment Configuration
- Common Knowledge
0x02 vRealize Operations Manager Installation
---
Reference Materials:
https://docs.vmware.com/cn/vRealize-Operations/8.6/com.vmware.vcom.vapp.doc/GUID-69F7FAD8-3152-4376-9171-2208D6C9FA3A.html
1. Download OVA File
Download page:
https://my.vmware.com/group/vmware/patch
Registration is required before downloading, then select the desired version for download
Select product vRealize Operations Manager. Note that pak files are upgrade packages; here select the ova file for download, as shown below
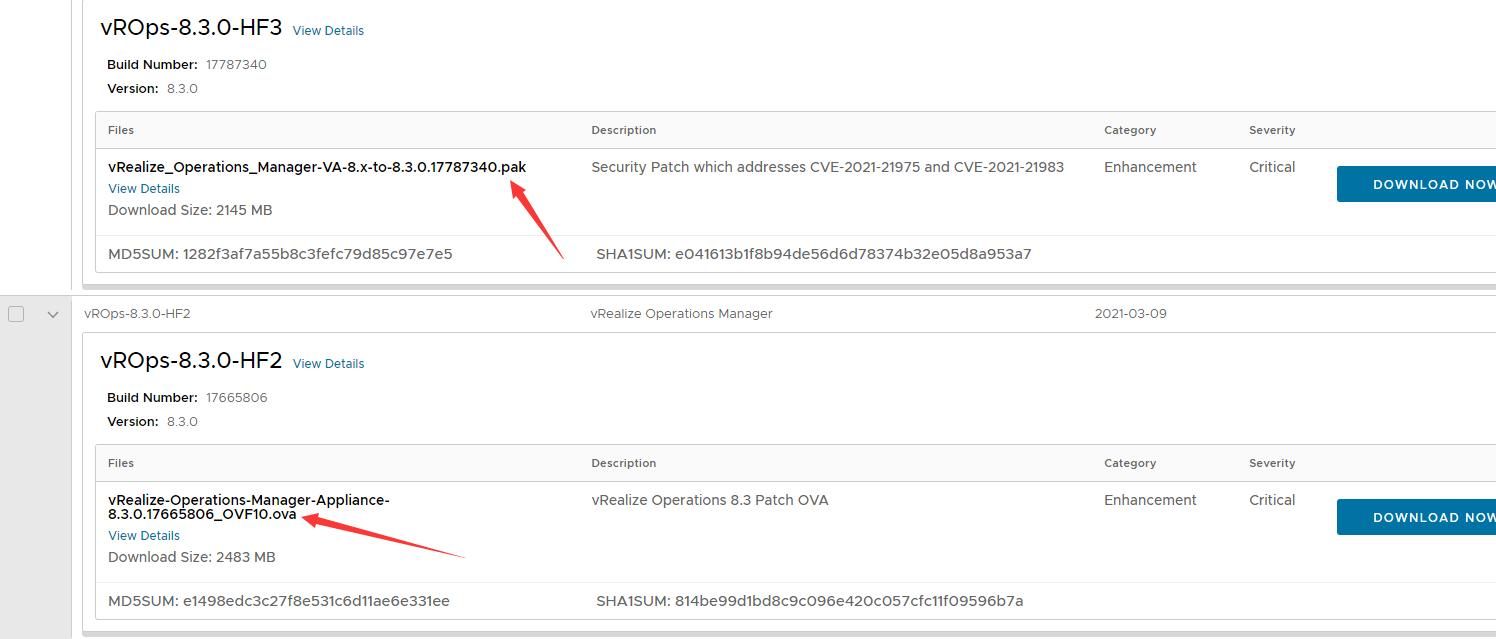
After filtering, only version vROps-8.3.0-HF2 includes an ova file; all others are pak files
2. Installation
(1) Import the OVA file in VMware Workstation
Select Remote Collector (Standard) on the configuration page, as shown below
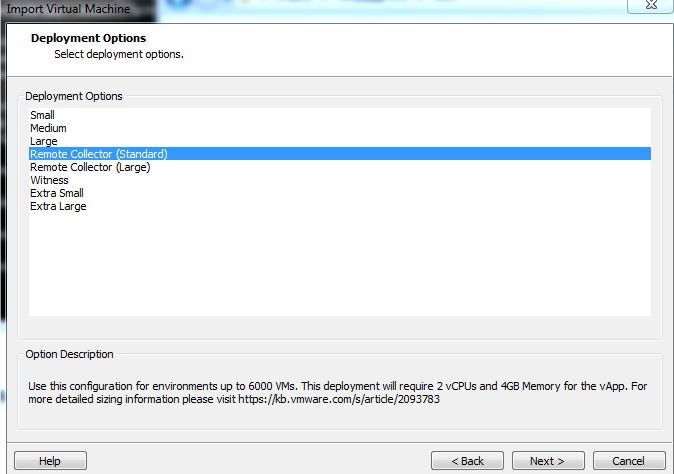
After the OVA file import completes, it will automatically power on for initialization. After initialization completes, as shown below
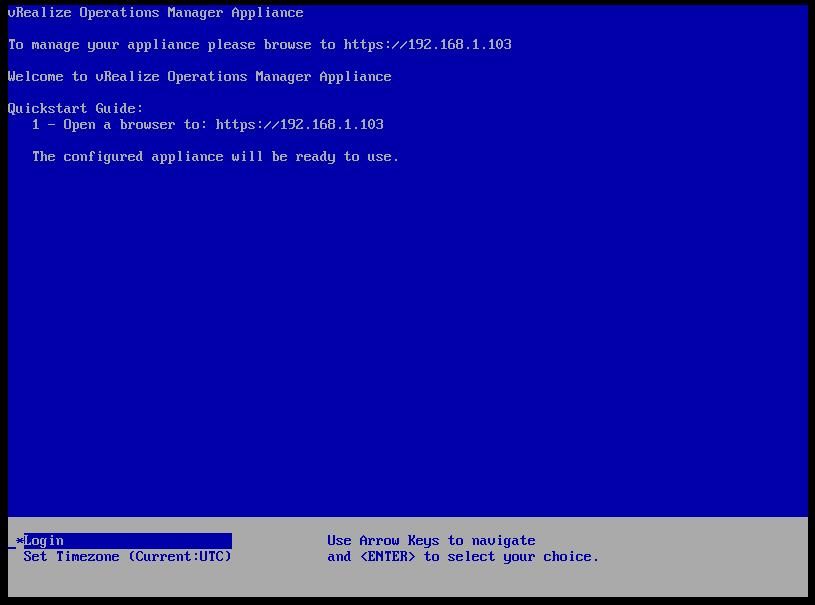
(2) Configuration
Access the configuration page https://192.168.1.103/
Select quick installation EXPRESS INSTALLATION
Set admin password
3. Set root user password
Select Login in the virtual machine, enter root, set the initial password for the root user
4. Enable remote login
Execute the command as root:
service sshd start
5. Enable remote debugging function
(1) Check the status of all services
systemctl status
The result is as shown in the figure below
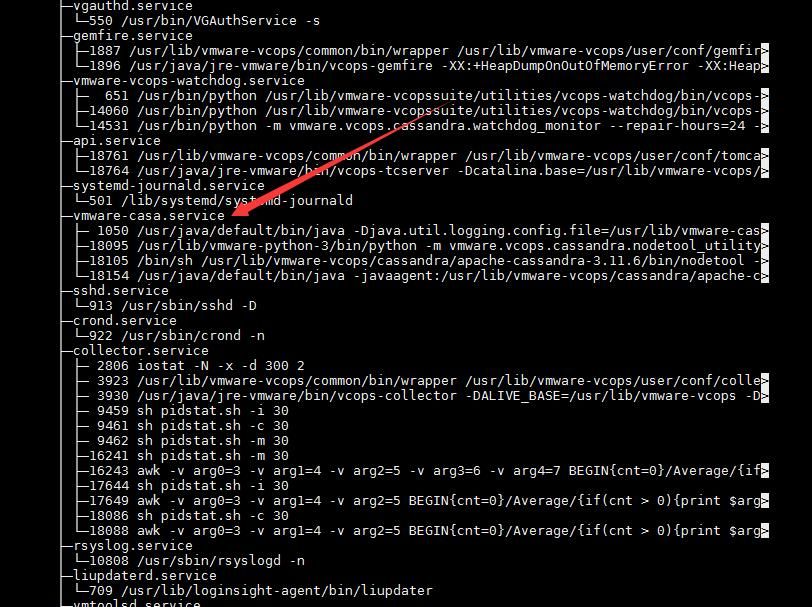
Locate the web-related service as vmware-casa.service
(2) View detailed information of vmware-casa.service
systemctl status vmware-casa.service
The result is as shown in the figure below
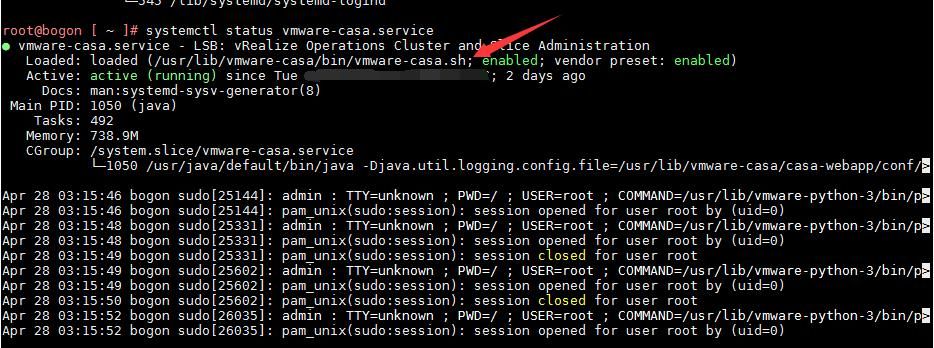
Locate the loaded file /usr/lib/vmware-casa/bin/vmware-casa.sh. After viewing its content and further analysis, the required configuration file /usr/lib/vmware-casa/casa-webapp/bin/setenv.sh can be identified.
(3) Add debugging parameters
Add the debugging parameter to the variable JVM_OPTS: -agentlib:jdwp=transport=dt_socket,server=y,suspend=n,address=8000
(4) Restart the service
service vmware-casa restart
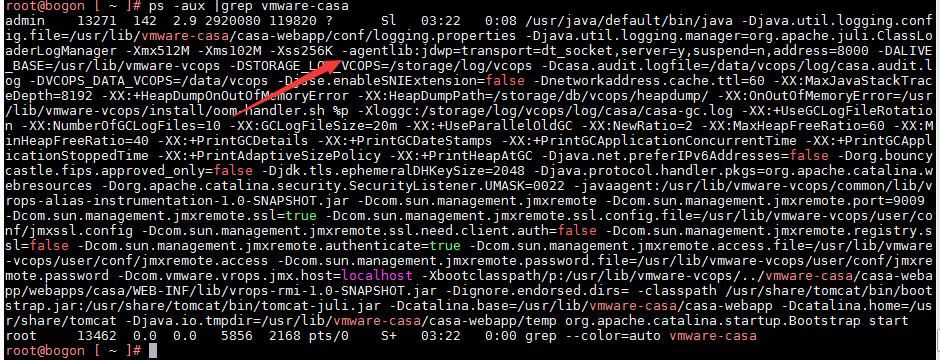
(5) Check if the debugging parameters have been changed:
ps -aux |grep vmware-casa
As shown in the figure below
(6) Open the firewall
Here, choose to clear the firewall rules: iptables -F
(7) Use IDEA to set remote debugging parameters
For the complete configuration method in IDEA, please refer to the previous article 'Setting Up Zimbra Vulnerability Debugging Environment'
0x03 Common Knowledge
---
1. Common Paths
Web directory: /usr/lib/vmware-casa/casa-webapp/webapps/
Log path: /storage/log/vcops/log/cas
Admin user password hash: /storage/vcops/user/conf/adminuser.properties
Database password location: /var/vmware/vpostgres/11/.pgpass
2. Database Connections
Database password content example:
localhost:5432:vcopsdb:vcops:J//mJcgppVIuGgzEuKIHGee9 |
Connect to database 1:
/opt/vmware/vpostgres/11/bin/psql -h localhost -p 5432 -d vcopsdb -U vcops |
Connect to database 2:
/opt/vmware/vpostgres/11/bin/psql -h localhost -p 5433 -d vcopsdb -U vcops |
Connect to database 3:
/opt/vmware/vpostgres/11/bin/psql -h localhost -p 5433 -d replication -U vcopsrepl |
3. Version Identification
Identification method:
Obtain configuration information through the API interface, and export detailed version information from the configuration data
Access URL: https://
The returned data is in XML format, and version information is contained within getCurrentVersionOfServer, as shown in the figure below

Python implementation details:
Since the returned data is in XML format and contains escape characters, these escape characters must be processed first during parsing
Example code:
def escape(_str): |
When using re for string matching, since the data spans multiple lines, it is necessary to add the parameters re.MULTILINE|re.DOTALL
Example code:
pattern_data = re.compile(r"getCurrentVersionOfServer(.*?)", re.MULTILINE|re.DOTALL) |
The complete code has been uploaded to GitHub, address as follows:
An open-source project
0x04 Summary
---
After we have set up the vRealize Operations Manager vulnerability debugging environment, we can proceed to study the vulnerability.